Stats
Statistics Tab#
Statistics tab includes four different parts:
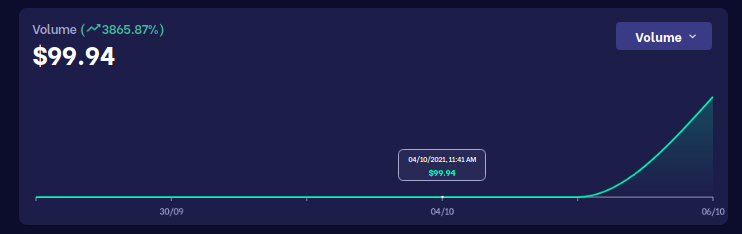
- the top part contains a line graph.
- the middle section consists of:
- Statistic cards
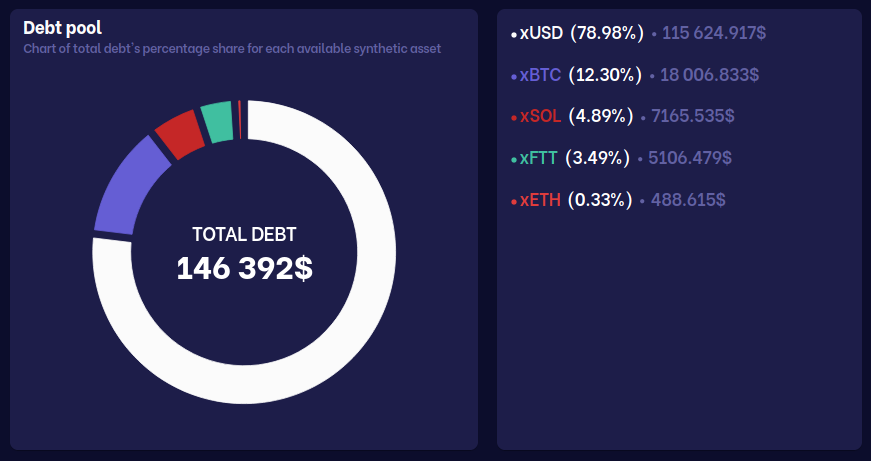
- Total debt chart
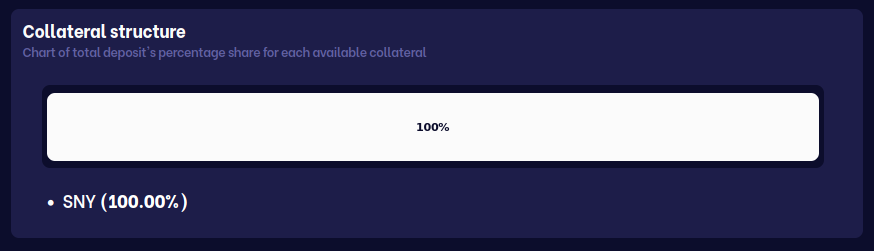
- the bottom part consists of a bar showing the collateral structure.
Top chart#
On the graph, we can observe the daily change:
- exchange volume
- liquidation value
- minted synthetics
- burnt synthetics
- user count
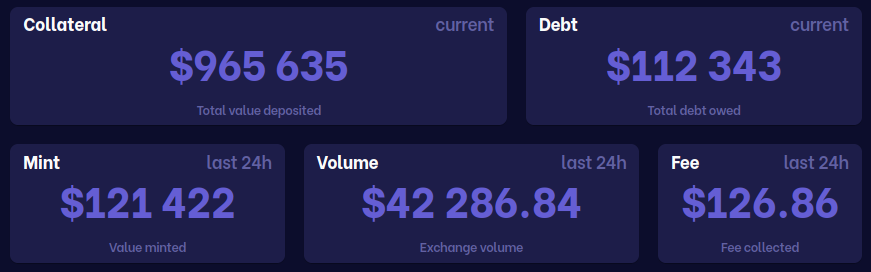
Statistic Cards#
There are five cards with:
- current value of the collateral
- current debt value
- volume from 24h ago
- fee from 24h ago
- mint from 24h ago
Debt Pool#
On the chart, we can observe the change of the debt in real-time and the proportion of total debt for each available synthetic asset.
Collateral structure#
On the chart, we can observe the debt changing in real-time and its distribution.